MLB Player Props: How to Find the Best MLB Player Props Today
A guide to MLB player prop betting covering market types, baseball-specific research strategies, and tools that help you find value.
By
Eric Pauly
9 min read
What Is an MLB Player Prop Tool?
An MLB player prop tool is research software that puts the inputs behind a baseball prop in one place: the starting pitcher matchup, the hitter's splits against that pitcher's arsenal, the ballpark, the weather, and the price at each sportsbook. The goal is to see whether a strikeout, hits, or total bases line reflects tonight's game or just a season average.
That second part is where baseball gets tricky. A Tarik Skubal strikeout line in Detroit, an Aaron Judge total bases prop in the Bronx, and a Kyle Schwarber home run price in Philadelphia all hinge on different variables, and a full slate can run 15 games deep. Player prop research tools collapse that into one screen, which is how you cover a nightly board without it eating your whole evening.
article Summary
An MLB player prop tool gathers pitcher matchups, pitch mix splits, park and weather data, and sportsbook prices so you can judge a baseball prop against tonight's conditions instead of season averages. The inputs that move MLB props most are the starter, the confirmed lineup, the park and weather, and the price across books. Props.Cash, PropFinder, PropsMadness, and Doink Sports cover the research side, while Prop Professor handles fair value pricing.
Why MLB Props Need Specialized Tools
Baseball props are environment bets. A hitter's talent barely changes from Tuesday to Wednesday, but the pitcher he faces, where he hits in the order, the park, the temperature, and the wind all do. Season averages blend every one of those conditions together, and opening prop numbers often lean on those blended figures before lineups and weather are final.
Volume is the other problem. A full night has around 30 starting pitchers and 270 hitters in lineups, with strikeout, outs, hits, total bases, home run, and RBI props on most of them. A tool that filters that board down to the spots where conditions disagree with the line is what makes MLB props workable.
Here is what actually moves each major MLB prop market, and what your tool should show you for it:
Strikeouts: the opposing lineup's strikeout rate against that pitcher's handedness, his recent pitch counts, and the home plate umpire's zone.
Pitcher outs recorded: pitch count leash, efficiency in pitches per inning, and how quickly that manager goes to the bullpen.
Hits: batting order slot, since it sets plate appearances, plus contact rate against the starter's pitch mix.
Total bases and home runs: park, temperature, wind direction, and how the hitter handles the pitch types he will see most.
Runs and RBIs: the team's implied run total and who hits around him in the lineup.
When I work a slate, I read that list backward from the price. If a line looks off, I want to know which of those inputs the book might be missing before I trust the gap.
Example
Example
Same hitter, two different bets. Kyle Schwarber's home run prop at Citizens Bank Park on a 90 degree July night sits in a hitter-friendly park where warm air helps the ball carry. At Oracle Park on a 58 degree evening, with the breeze blowing in from right field where a left-handed pull hitter does most of his damage, the environment works against him. If a book hangs a similar price in both spots, the Oracle Park over is the weaker bet, and his season home run total will not tell you that.

What to Look for in a Good MLB Props Tool
Plenty of prop tools feel built for basketball first, with baseball added later. The ones that handle MLB well treat the pitcher and hitter as a matchup, not two separate stat pages. These are the four checks I run when I test one on a baseball board.
Pitch Mix Splits Beyond Left and Right
Handedness splits are a starting point, but a hitter who punishes fastballs and chases sweepers is a different player against a sinkerballer than against a slider-heavy starter. Look for tools that grade the hitter against the pitch types the opposing starter actually throws. Props.Cash added matchup grades, strike zone charts, and pitch-level data to its MLB pages in its 2026 redesign. PropFinder filters player data by the opposing pitcher's pitch mix, and PropsMadness grades matchups batter by batter against each pitch type, with a multi-select filter that groups sliders and sweepers into one query.
Park and Weather Next to the Prop
Weather only helps if you see it next to the line. Doink Sports puts a Weather Man module with wind and temperature beside its baseball props, PropFinder shows conditions at every stadium in one view, and PropsMadness pulls park and weather readouts through a partnership with Ballpark Pal, grading each game as hitter-friendly or pitcher-friendly. When I tested Doink Sports, having the wind sit next to the prop cut a separate weather app out of my process entirely.
Hit Rates That Show the Sample
A 7 for 10 hit rate on an over looks strong until you split it and find that six of those games came against right-handers and tonight's starter is a lefty. Good tools let you split player prop hit rates by pitcher handedness, home and away, and opponent, and they show how many games sit behind each number. Be careful with batter versus pitcher history. Twelve career plate appearances against one starter is noise, not a trend.
A Fair Price, Not Only a Projection
A projection tells you what a player might do. It does not tell you whether -140 is a good price for it. For that you need fair odds built from sharper books, which is what Prop Professor is built around. Its +EV screens compare MLB prop prices across sportsbooks and fantasy apps against a fair value line, and when I ran its odds screen on a midweek MLB slate, the prices matched the books within a couple of seconds. Code BETSMART takes 25% off your first month.
Advanced MLB Prop Research: The Inputs That Get Overlooked
Once you have the matchup and the environment, the next layer decides how many chances a player gets. Counting stat props are opportunity props first.
Batting Order Sets the Plate Appearances
Each spot down the lineup costs a hitter roughly a tenth of a plate appearance per game. League averages land close to this:
Leadoff: about 4.65 plate appearances per game
Third: about 4.45
Fifth: about 4.2
Seventh: about 4.0
Ninth: about 3.75
That gap matters most on hits and total bases overs, where one extra trip to the plate changes the math. It is also why I filter to confirmed lineups only before I bet a hitter prop. Home teams add a wrinkle: if they lead after the top of the ninth, they skip their last turn at bat.
Pitch Count Leash and Bullpen Plans
Strikeout and outs recorded props live and die on how long the starter stays in. Check his pitch counts over his last three or four starts, whether he is coming off an injured list stint, and whether his team is managing an innings limit. A starter capped around 85 pitches needs an efficient night to clear a high strikeout number. Openers and bullpen games break these props entirely, so confirm the listed starter is expected to work deep.
Umpires and the ABS Challenge
Home plate umpires with wider zones help strikeout overs, and assignments post on game day, so check who is behind the plate before you bet a strikeout number. MLB's automated ball-strike challenge system, new for the 2026 season, lets teams overturn a limited number of missed calls each game. That trims the umpire effect on the pitches teams choose to challenge, but the zone still decides the vast majority of calls.
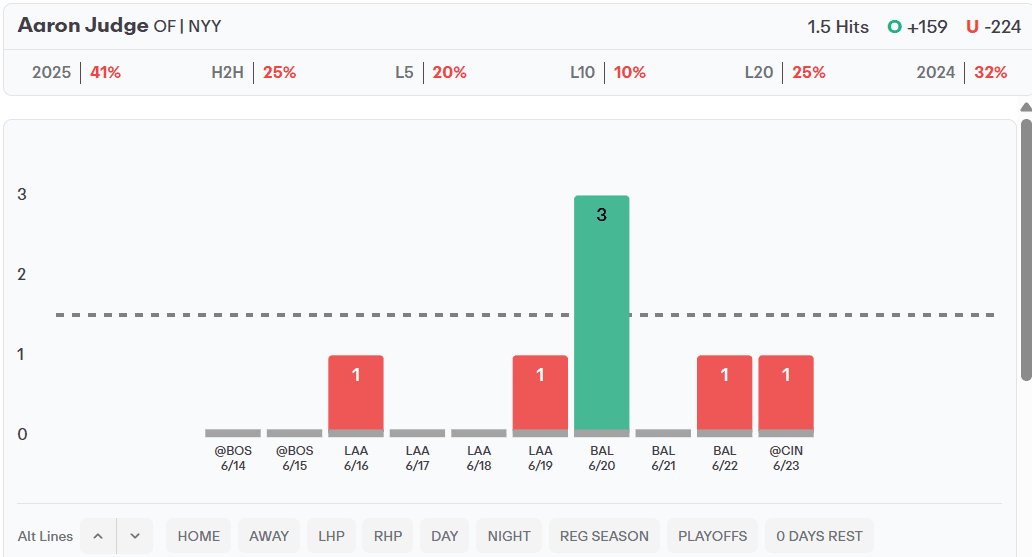
Hit rate screens like the Aaron Judge view below come last in this layer, not first. A strong 10-game hit rate means more once you know he is hitting second against a starter on a normal leash.
Example
Example
Say the Cubs move Pete Crow-Armstrong from seventh to second for a night, and assume he collects a hit in about 23% of his plate appearances. At roughly 4.0 trips to the plate, his chance of at least one hit is about 65%. At roughly 4.55 trips, it climbs to about 70%. In odds terms, that moves a fair price on his hits over 0.5 from around -184 to around -228, driven entirely by where his name sits on the lineup card.
Which MLB Player Prop Tool Fits Your Process
No single MLB player prop tool does every job well, so the useful question is which part of your process needs covering. Here is how the tools I have reviewed split up for baseball:
Props.Cash ($19.99/month): fast hit rate and trend research, with MLB matchup grades, strike zone charts, and pitch-level data. The 7-day free trial needs no card, and code BETSMART takes 30% off your first paid month. It fits bettors who scan a full slate quickly.
Prop Professor ($49/month All Access): the pricing layer, with +EV screens, real-time odds, and fair value lines on MLB props across sportsbooks and DFS apps. Code BETSMART takes 25% off your first month. It fits bettors who already have an opinion and want to know which book has the right number.
PropFinder ($14.99/month): pitch mix filters, a PF rating that factors in how the opposing pitcher handles the batter's side of the plate, and MLB cheat sheets for home runs allowed, extra base hits allowed, hit streaks, and batter versus pitcher data. Code BETSMART takes 30% off the first month.
PropsMadness ($25/month): pitch-level matchup grading, Ballpark Pal park and weather data, and odds from 40+ sportsbooks. Our PropsMadness review covers the late August update that added multi-select pitch mix. Code BETSMART takes 25% off your first purchase.
Doink Sports (free plan, Starter $19.99/month): Batter vs Pitcher and Weather Man modules beside odds from 25+ sportsbooks. The free plan covers one game per league, and the Doink Sports review breaks down all three plans.
Outlier (from $19.99/month): a mobile-friendly research app with an MLB player prop preset for +EV filtering. Our Outlier vs Props.Cash breakdown covers which one suits a nightly routine.
One research tool plus one pricing tool covers both halves of the job. For a wider look at what else supports baseball, browse our MLB betting tools page.
Example
Example
Say the Cubs move Pete Crow-Armstrong from seventh to second for a night, and assume he collects a hit in about 23% of his plate appearances. At roughly 4.0 trips to the plate, his chance of at least one hit is about 65%. At roughly 4.55 trips, it climbs to about 70%. In odds terms, that moves a fair price on his hits over 0.5 from around -184 to around -228, driven entirely by where his name sits on the lineup card.

How to Find the Best MLB Player Props Today
MLB props run on a pregame clock. Numbers post before lineups are known, lineups drop a few hours before first pitch, and weather keeps updating until the game starts. Doing each check at the right point on that clock matters more than doing every check at once. This is the order I work a slate in.
When Lines Post: Start With the Starters
Every MLB prop starts with who is pitching. I sort the slate by starting pitcher first, flag strikeout arms facing lineups that swing and miss against their handedness, and flag hittable starters facing lineups with power against their pitch mix. Market attention matters here too. Strikeout lines on marquee aces like Tarik Skubal and Paul Skenes get a lot of eyes and tend to be priced tightly, so softer numbers more often sit on back-end starters and the hitters facing them.
When Lineups Drop: Recheck Every Hitter Prop
Lineups usually post a few hours before first pitch, and this is where hitter props move. A day off for a regular or a platoon bat sliding into the two hole can change the math on a prop that looked fine that morning. Filter your tool to confirmed lineups and rerun your shortlist.
Before First Pitch: Weather and the Final Price
Check wind and temperature last, because forecasts shift through the afternoon. Wind blowing out at Wrigley Field boosts home run and total bases props, and wind blowing in suppresses them. Coors Field's altitude inflates offense and also flattens breaking balls, which cuts into strikeout numbers there. Then compare the prop across every book you have. The same total bases over can sit at -110 at one book and -135 at another, and shopping that gap is part of the edge, not an afterthought.
Final Thoughts
MLB props reward bettors who treat every line as a matchup in a specific park on a specific night. Start with the starters, recheck hitter props when lineups post, and save weather and price shopping for last. Pair a research tool like Props.Cash, PropFinder, or PropsMadness with a pricing tool like Prop Professor, and let them narrow a 15-game slate to the few props where tonight's conditions and the sportsbook number disagree. Process over picks, all 162 games of it.
MLB Player Prop Tool FAQ

Additional Resources
Explore our curated selection of guides and tools to help promote responsible gambling.

Rugby Betting Guide: Union, League, Markets and Key Margins
How rugby union and league price differently, the markets worth betting, the 2026 calendar, and the tools that actually cover rugby.

Esports Betting Guide: Markets, Formats, and Finding Value
A practical esports betting guide covering markets, series formats, patches, line shopping, and the integrity and legal checks to run before you bet.

Regression Betting Explained: How to Stop Paying for Luck
How regression to the mean creates betting value, which stats in each sport snap back, and how to bet it without overreacting to streaks.

Betting Model Building Explained: From Raw Data to a Fair Price
Build a betting model that prices bets, test it against the market, and size what it finds.